Left Ventricle Filling in Sirshasana and Sarvangasana Yogic Postures
Human Physiology. Vol. 22. №6. 1996. pp. 665-671. Translated from Fiziologiya Cheloveka, Vol. 22, №6. 1996. pp. 27-34. Original Russian Text Copyright © 1998 by R.S. Minvaleev, A.A. Kuznetsov, A.D. Nozdrachev and Yu. Kh. Lavinskii
Left Ventricle Filling in Sirshasana and Sarvangasana Yogic Postures
R. S. Minvaleev, A. A. Kuznetsov, A. D. Nozdrachev and Yu. Kh. Lavinskii
Abstract - Pulsed and constant-wave Doppler echocardiography was used to study 15 young men and women who performed sirshasana (head-stand) and sarvangasana (shoulder-stand). The increase of the preload on the left heart in sirshasana resulted in a significant increase of the early LV diastolic filling (E) and a rapid shortening of the LV isovolumetric relaxation time (IVRT). Heart rate (HR) increased in all subjects who performed sarvangasana, E and IVRT increased to a lower extent than in sirshasana, and the minimum rate at the length of LV slow diastolic filling (SDV) increased. The transition from a supine to upright posture increased HR, decreased E, significantly decreased E/A, and increased SDV. Correlation and factor analyses revealed that the diastolic filling volume strongly influenced E (direct dependence) and IVRT (inverse dependence). SDV displayed a strong and direct correlation with HR. A smaller elevation of preload in sarvangasana in comparison to sirshasana was due to the positive chronotropic effect of djalandhara-bandha, that is, pressing the mandible against the thyroid gland.
The so-called inverse Hatha-Yoga postures sirshasana (head-stand) (Fig.1) and sarvangasana (shoulder-stand) (Fig.2) were employed to study the features of transmitral blood flow at an increased preload on the left heart under antiorthostatic conditions [1].
Fig.1. Sirshasana or head-stand
Fig.2. Sarvangasana or shoulder-stand
Studies on diastolic function of the left ventricle by means of transmitral blood flow (TMBF) measurement by Doppler echocardiography belong to a rapidly developing area of cardiology. Nevertheless, several factors determining the velocity profile of blood flow in the left heart chambers are often underestimated. For example, TMBF is known to strongly depend on the preload of the left heart [2-4]. This work shows these effects caused by head-down antiorthostatic Hatha-Yoga postures.
SUBJECTS AND METHODS
The study was performed with 15 healthy subjects (7 males and 8 females) aged 19 through 42. The selection criterion was the ability to tolerate sirshasana for 4-5 min required for intracardiac blood flow recording. All individuals practised Hatha-Yoga. Reference data were obtained from previous tests with a transition from the left recumbent position to standing performed with 16 females aged 18 through 35. Primary indices were recorded in the supine position. Then the individuals assumed the sirshasana posture. After this, the measurements were repeated in supine subjects, and then echocardiographic testing was carried out in sarvangasana posture (Figs. 4-6).
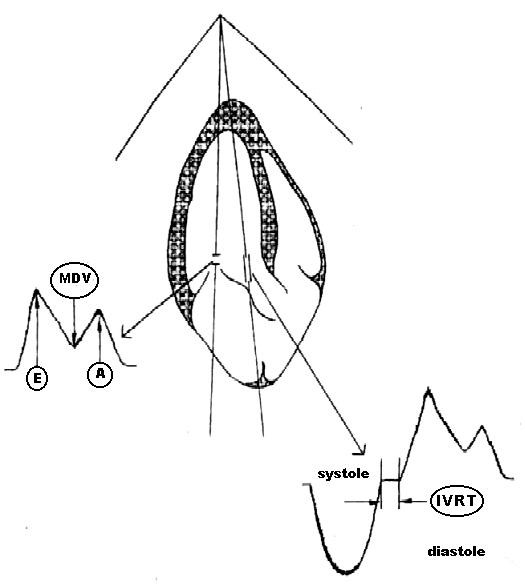
Fig. 3. The scheme of TMBF and IVRT recording and measurement (explanations are given in the text).
Ultrasound studies of the heart were performed with a Hitachi EUB-565 instrument (Japan) equipped with a sectorial transducer with a scanning frequency of 2.5 MHz. Indices of transmitral blood flow measured by pulsed Doppler echocardiography (Fig. 3) were (1) peak blood flow velocity in early diastole (E), cm/s; (2) peak blood flow during atrial systole (A), cm/s; (3) minimum diastasis blood flow velocity (SDV), cm/s; and (4) velocity ratio (E/A). For this purpose, a controlled volume was measured between the edges of the opened mitral valve cusps.
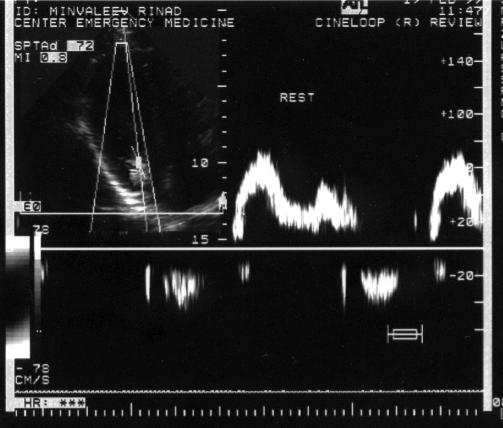
Fig. 4. Transmitral blood flow in the initial position
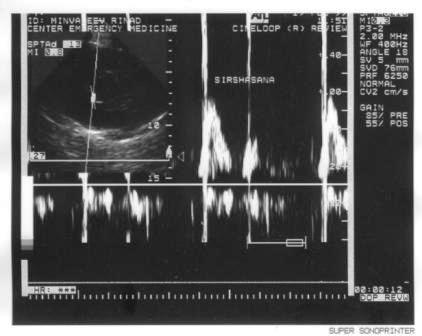
Fig.5. Transmitral blood flow during sirshasana
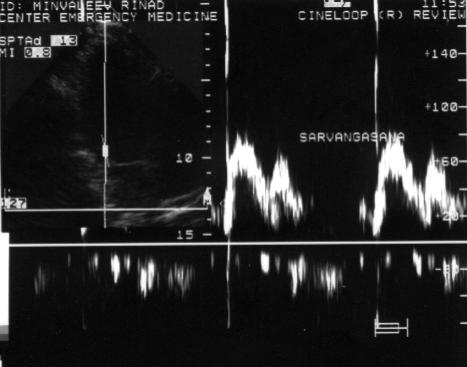
Fig.6. Transmitral blood flow during sarvangasana
At that moment, the Doppler frequency filter was selected so that it permitted peak and near-zero velocities to be recorded. The peak deviations of TMBF that showed extreme values were determined at maximum inspiration (i) and expiration (e). For this purpose, an approximate 20-s recording was replayed in a cinema loop mode. The subjects were asked to breathe with a natural rhythm because forced breathing would inevitably interrupt Doppler recordings, because the acoustic window is blocked by expanding lungs. The left ventricle isovolumetric relaxation time (IVRT, ms) was then measured by constant-wave Doppler echocardiography as an interval between the termination of aortic ejection and the start of mitral blood flow. IVRT displayed no consistent changes during breathing: therefore, the mean of seven to ten measurements was determined. Heart rate (HR, beats/min) was measured during blood flow recording. Echocardiograms were recorded on a videotape, and the parameters were read out and computed after the test was completed. The results were subjected to statistical analysis, and the significance of changes in particular parameters was estimated by matched-pairs Student’s t-test. The results were also studied by correlation and factor analyses [5] using STATGRAPHICS program [6]. In the initial supine position, all TMBF parameters display considerable fluctuations with breathing; E ranges between 78.7±2.7 during inspiration to 96.3±3.2 cm/s during expiration (p<0.01); A, 56.5±3.0 to 44.6±2.5 cm/s (p<0.01); E/A ratio, 1.4 ± 0.1 to 2.2±0.1 (p<0.001); and SDV, 24.2±4.1 to 12.2 ± 1.9 cm/s (p<0.05). Thus, inspiration decreased E and increased the maximum atrial contraction rate A. This was followed by a decrease in the E/A ratio; the minimum diastasis blood flow was higher during inspiration than during expiration. In sirshasana, an abrupt increase in TMBF at the early filling stage occurred (Ei reached 112.3 ± 3.8; EC 140.0±5.1 cm/s, p<0.001). The increase of blood flow during atrial systole was recorded only during expiration (Ae, 59.8±5.0 cm/s, p<0.05). The E/A ratio changes were insignificant. SDV blood flow increased during both inspiration and expiration (SDVi, 38.9 ± 5.2 cm/s, p< 0.05; SDVe, 30.3 ± 5.8 cm/s, p< 0.01 ). LV relaxation time diminished drastically (IVRT was 77.9 ± 1.9 ms in supine subjects and 52.8 ± 2.1 ms in sirshasana, p<0.001). HR increased from 71.7 ± 2.7 to 84.3 ± 4.2 beats/min, p< 0.01). After transition to the supine position, all parameters returned to their near-basal levels recorded at the beginning of the study. The breath-induced fluctuations of TMBF parameters, except for A, remained significant as well. During sarvangasana, blood flow increased in early diastole (Ei, 88.6 ± 3.5; Ee, 115.0±5.8 cm/s, p<0.05), atrial systole during inspiration (Ai, 67.3±5.1, p<0.01), and diastasis (SDVi, 45.7±5.5; SDVe, 31.8±5.3 cm/s, p<0.001). The E/A ratio decreased during inspiration (p<0.05). IVRT shortened (to 67.1±2.8, p<0.001). HR increased (to 88.1±2.8 beats/min, p<0.001). The comparison of TMBF and LV relaxation parameters during sirshasana and sarvangasana revealed significant differences between the postures. E was significantly higher during sirshasana (differences for Ei, p<0.001; for Ee, p<0.01). IVRT was shorter in sirshasana (p<0.001). We also found that certain subjects had no increase in HR in sirshasana, whereas mild tachycardia was registered in sarvangasana in 14 of 15 subjects. This is why we divided the group of subjects into two subgroups depending on their HR responses to sirshasana. In group I (four males and three females), HR during sirshasana was nearly equal to the basal HR (supine, 73.4±2.3 beats/min, sirshasana, 76.0±2.9 beats/min). and HR increased from 69.4±5.5 to 92.6±5.4 beats/min, p<0.05 in group II (three men and four women). The results are shown in Table 1 separately for the two subgroups. Table 1 shows that IVRT decreased equally in both subgroups (I, 52.3±3.1 ms and II, 52.0±3.4 ms). whereas the rate of early diastolic blood flow during expiration (i.e., the peak E value) was higher in group I (I, 153.6±6.0 cm/s; II, 127.9±6.0 cm/s, p<0.05). Note that two subgroups showed differences in the initial values of EC and IVRT. The first index was higher and the second lower in subjects who did not develop tachycardia in sirshasana. Moreover, the first subgroup performed sirshasana better, which could explain tachycardia in the second subgroup. The mechanism of the total tachycardia during sarvangasana is unclear because hydrostatic conditions of the left heart filling appear to be equal for these postures. Nevertheless, the necessary element of sarvangasana is the pressing of the chin to the sternum (djalandhara-bandha). We tested the hypothesis that this was the main cause of the increase in HR during sarvangasana in an additional study with TMBF recordings in eight healthy volunteers (three men and five women) in a kneeling position. The initial TMBF values were recorded at the vertical position of the head and after maximum head lowering while pressing the chin to the sternum. During the posture with the chin pressed to the sternum in this particular study, Ei decreased (p<0.05) and SDVe significantly increased (p<0.01), whereas HR rate had a slight tendency to accelerate (p>0.05). Similar dynamics were observed during the orthostatic decrease in the left heart preload.
We can only speculate on the existence of mechanisms that mediate the above-described effects. Nevertheless, the influence on HR from the carotid sinus can be excluded because this should be expected to decrease HR. HR actually increased in djalandhara-bandha and sirshasana. These data implicate the thyroid gland in responses to djalandhara-bandha. The compression of the gland by the chin possibly promotes the release (or, more exactly squeezing out) of additional portions of thyroid hormones into the blood. Our hypothesis can be verified by measuring the blood levels of thyroid hormones in humans performing these postures, which will be done in future studies. This issue is of special interest because hormonal effects of postural responses were not investigated thus far. We compared these results with earlier studies of TMBF upon transition from supine to standing, which reduced the left heart preload. During the blood flow recording immediately after the transition of subjects to a vertical position, their early diastolic blood flow decreased (Ei, from 75.1±2.6 to 62.2±2.4 cm/s, p<0.001; Ee, from 87.3±2.8 cm/s. p<0.05), diastasis blood flow increased (SDVi, from 17.8±2.8 to 29.7±2.8 cm/s; SDVe, from 11.2±1.9 to 20.0±2.4 cm/s, p<0.01), and the ratio of peak rates E/A decreased (from 1.6±0.1 to 1.3±0.1 during inspiration and from 2.4±0.2 to 1.9±0.2 during expiration. (p<0.05). HR significantly increased from 64.6±2.5 to 74.7±1.9 beats/min (p<0.01).
DISCUSSION
Among the subgroups studied, one was found to increase the venous return to the heart without changing HR. In this case, only two parameters (the rate of early diastolic filling and the time ot LV isovolumetric relaxation) changed significantly. We hypothesized that these indices are strongly volume-dependent. IVRT is known to depend on the left atrial pressure and the time of mitral valve opening (the duration LV filling) [7]. The latter condition suggests that this parameter can provide estimates for changes in the LV diastolic function, which precedes a disturbance of its pumping function [8]. We excluded the possibility of relaxation and contraction disorders by selecting only healthy individuals for this study. Nevertheless, antiorthostasis caused obvious changes of IVRT in both subgroups. A shortening of the interval between aortic ejection and mitral blood influx accompanies restrictive changes in LV [9, 10] and is found during expiration in patients with pericardial effusion [11]. This data cannot be interpreted as Appleton’s type II diastolic LV dysfunction. However, there is a similarity to respiratory fluctuations of LV filling. The LV filling and correspondingly its stroke volume decrease during inspiration; expiration causes opposite effects. In the cases of pericardial effusion, these fluctuations are abnormally large. No significant changes in IVRT were found during normal breathing, but the increased blood return to the heart in orthostatic postures resulted in a considerable shortening of IVRT in both subgroups.
Table 1. Dynamics of transmitral blood flow and left ventricle relaxation parameters during sirshasana (head-stand) and sarvangasana (shoulder-blade-stand)
|
Parameter |
Sub-group |
Initial position |
Sirshasana |
Initial position |
Sarvangasana |
|||||||||||
|
|
X±m |
1 |
3 |
X±m |
1 |
2 |
3 |
X±m |
1 |
3 |
X±m |
1 |
2 |
3 |
4 |
|
|
Inspiration |
|
|
|
|
|
|
|
|
|
|
|
|
|
|
|
|
|
Ei cm/s |
I |
81.9±5.0 |
|
|
118.9±7.0 |
|
|
|
83.7±3.2 |
|
|
91.4±5.6 |
|
ns |
|
* |
|
|
II |
77.0±2.7 |
|
ns |
107.9±2.9 |
|
|
ns |
74.4±3.3 |
|
* |
88.l±4.8 |
|
|
ns |
|
|
Ai cm/s |
I |
53.9±1.5 |
|
|
68.4±11.9 |
|
ns |
|
48.0±4.7 |
|
|
69.3±9.0 |
|
ns |
|
ns |
|
|
II |
60.4±6.2 |
|
ns |
74.7±9.7 |
|
ns |
ns |
50.4±3.9 |
|
ns |
67.9±6.3 |
|
* |
ns |
ns |
|
E/Ai c.u. |
I |
1.5±0.1 |
|
|
2.0±0.3 |
|
ns |
|
1.8±0.2 |
|
|
1.4±0.2 |
|
ns |
|
ns |
|
|
II |
1.4±0.1 |
|
ns |
1.6±0.2 |
|
ns |
ns |
1.5±0.1 |
|
ns |
1.4±0.1 |
|
ns |
ns |
ns |
|
MDVi cm/s |
I |
22.0±4.1 |
|
|
32.9±5.9 |
|
ns |
|
15.7±0.9 |
|
|
47.4±8.3 |
|
|
|
ns |
|
|
II |
27.1±8.0 |
|
ns |
47.1±8.9 |
|
ns |
ns |
21.0±4.3 |
|
ns |
48.0±8.1 |
|
* |
ns |
ns |
|
IVRT cm |
I |
74.4±2.2 |
|
|
52.3±3. |
|
|
|
81.9±0.9 |
|
|
63.l±4.0 |
|
|
|
ns |
|
|
II |
83.0±1.9 |
|
* |
52.3±3.4 |
|
|
ns |
86.9±4.9 |
|
ns |
71.6±4.0 |
|
|
ns |
|
|
HR |
I |
73.4±2.3 |
|
|
76.0±2.9 |
|
ns |
|
66.9±2.5 |
|
|
87.7±3.6 |
|
|
|
|
|
beats/min |
II |
69.4±5.5 |
|
ns |
92.6±5.4 |
|
|
* |
67.4±4.4 |
|
ns |
91.4±3.9 |
|
|
ns |
ns |
|
Expiration |
|
|
|
|
|
|
|
|
|
|
|
|
|
|
|
|
|
Ee cm/s |
I |
103.4±4.1 |
|
|
153.6±6.0 |
|
|
|
104.1±2.0 |
|
|
115.9±10.3 |
ns |
ns |
|
|
|
|
II |
90.6±4.1 |
|
* |
127.9±6.0 |
* |
|
* |
92.7±4.4 |
|
|
110.4±6.5 |
* |
* |
ns |
ns |
|
Ae cm/s |
I |
43.6±3.0 |
** |
|
53.3±6.6 |
ns |
ns |
|
42.6±5.0 |
ns |
|
54.3±6.7 |
ns |
ns |
|
ns |
|
|
II |
45.3±4.6 |
|
ns |
65.1±8.3 |
ns |
ns |
ns |
49.7±6.0 |
ns |
ns |
56.3±6.8 |
ns |
ns |
ns |
ns |
|
E/Ae c.u. |
I |
2.4±0.1 |
|
|
3.1±0.4 |
* |
ns |
|
2.7±0.3 |
|
|
2.3±0.3 |
* |
ns |
|
ns |
|
|
II |
2.1±0.3 |
* |
ns |
2.2±0.3 |
ns |
ns |
ns |
2.1±0.2 |
ns |
ns |
2.±0.3 |
* |
ns |
ns |
ns |
|
MDVe cm/s |
I |
13.0±2.9 |
ns |
|
23.4±6.4 |
ns |
ns |
|
11.4±1.8 |
ns |
|
28.7±7.9 |
ns |
ns |
|
ns |
|
|
II |
10.7±2.9 |
ns |
ns |
39.1±10.1 |
ns |
|
ns |
8.7±1.7 |
|
ns |
37.0±8.1 |
ns |
|
ns |
ns |
Notes: Subgroups I and II comprised 7 subjects each. The significance of parameters is explained in the text. Significance: *p < 0.005; ** p < 0.01: *** p< 0.001; ns—not significant; (1) significance of breathing fluctuations; (2) significance of changes from the initial position; (3) significance of differences between two subgroups; (4) significance of differences between sirshasana and sarvangasana in a subgroup.
Discussion of the velocity spectrum of transmitral blood flow inevitably touches the problem of LV diastolic function. Therefore, the E/A ratio of peak velocities could not be left without attention. This parameter is considered as one of the most sensitive markers of the LV diastolic dysfunction [15], and its value shows a strong correlation with LV end-diastolic pressure measured through cardiac cathers (R=0.84, Channer et al. [17]). Moreover, the relation between E/A and HR was found (high inverse correlation, r=-0.78 in young healthy subjects [18]). This relation can be reflected, to some extent, in the prevailing of A velocity over E, which is recorded in human fetuses, the E/A ratio gradually approaches I during gestation [19]. In our study, E/A was practically unaltered under antiorthostatic conditions, which is evidence of an undisturbed LV diastolic function and an insignificant relationship between this parameter and LV preload. Respiratory fluctuations of E/A were noticeable in most cases along with stable tendency to a decrease in this ratio during inspiration.
Additional evidence supporting our hypothesis comes from the correlation and factor analyses performed on 76 cases (these data were not analyzed because IVRT was not recorded in orthostatic postures). The strongest correlation for HR was found with SDV (r=0.86 during inspiration and r=0.77 during expiration, p<0.001), HR correlations of intermediate levels were found with blood flow velocity during atrial systole (r=0.64 during both breathing phases, p<0.001) and with IVRT (r=-0.51, p<0.001). TMBF values during the fast filling phase were not significantly correlated with HR (p>0.05). Factor analysis reveals more relationships between the recorded parameters. This analysis determines new indexes, main components, or factors (F), in addition to those subjected to the analysis. Correlations between the parameters and factors explain the nature of these new factors and allow their relationships with initial parameters to be ranked. The results of the factor analysis of blood flow are shown in Table 2, where only strong correlations with factors arc presented. Factor analysis showed that SDV, HR, A, and the ratio of peak TMBF rates during inspiration have close correlations with Fl. This factor has a close relationship with HR and can be identified as the heart rate factor. The relationship between this parameter and E is very weak (r=0.13 during inspiration and r=0.14 during expiration). Nevertheless, factor F2 has a strong correlation with E (r=0.95 during inspiration and r=0.91 during expiration). This factor was shown to be closely correlated with IVRT (r=-0.71). These particular parameters changed abruptly in subjects who had no increase in HR in sirshasana, therefore, F2 can be named the LV preload factor.
Table 2. Factor analysis of blood flow parameters
|
Parameter |
Correlation coefficient with the factor |
The percentage of contribution to total variance |
Factors |
|
SDVi |
0.90 |
|
|
|
Ai |
0.88 |
|
|
|
HR Ae |
0.87 0.83 |
48.3 |
Fl Heart rate factor |
|
SDVe |
0.82 |
|
|
|
E/Ai |
-0.71 |
|
|
|
Ei |
0.95 |
|
F2 |
|
Ee IVRT |
0.91 -0.71 |
25.1 |
Left ventricle preload factor |
|
|
|
|
F3 |
|
E/Ae |
0.98 |
9.2 |
Left ventricle diastolic function factor |
Finally, F3 had a strong correlation with only one variable E/A during expiration (r=0.98). It was indicated above that none of the subjects in this study had LV diastolic dysfunction. This can explain why the ratio of peak velocities being the most sensitive marker of LV relaxation dysfunction was the least sensitive to antiorthostatic challenge. In this case, F3, the least significant factor in our sample (its contribution to the total variance was only 9.2%), can be identified as LV diastolic function factor. Statistical analysis suggests that E depends on the LV diastolic blood filling volume, enabling the following interpretation of these data. Orthostatic challenge decreases LV diastolic filling, resulting in a decrease in Ei. In contrast, antiorthostasis increases LV diastolic filling volume, which is accompanied by an increase in Ei. The interaction between two processes should be taken into consideration: the filling volume of the left heart and heart rate. We attempted to discriminate between them. An increase in HR causes diastolic shortening and therefore leads to a limitation of blood volume in LV by decreasing the duration of the filling period. Inverse relationships between diastolic volume and HR are reflected in our study by inverse correlations of IVRT (which depends on diastolic volume) and HR (r=-0.51, p<0.001). This explains why individuals who had no HR increase in sirshasana had no significant E increase in sarvangasana. The transition to sirshasana caused a maximum increase in diastolic filling volume, whereas this elevation was associated with the heart rate increase only upon the transition to sarvangasana. Therefore, there was no significant increase in E. The problem of SDV measurements requires special discussion. In this study, we found that blood inflow to LV persisted in most cases in the middle of diastole during diastasis. This prompted us to measure this minimum diastasis rate. Our data showed that SDV is the variable with the highest dependence on HR. This is a significant hemodynamic characteristics.
We suggest that it can provide estimates of the left atrial preload under certain conditions. The higher the preload magnitude, the more pronounced the atrial systole itself should be. This dependence is consistent with the results of statistical analysis. In our sample. SDV had a strong correlation with A (r=0.70-0.78, p<0.001 during different breathing phases).
CONCLUSIONS
(1) Preload fluctuations caused by the transition of humans from a horizontal position to standing (orthostatic test) or to antiorthostatic Hatha-Yoga postures sirshasana and sarvangasana caused significant changes in transmitral blood flow.
(2) The maximum blood flow velocity in the early diastole is the transmitral blood flow parameter exhibiting the highest dependence on the amount of blood entering the left ventricle. The left heart preload has a strong inverse correlation with the left ventricular isovolumetric relaxation time.
(3) The minimum blood flow rate during slow diastolic filling is the transmitral blood flow parameter having the highest dependence on HR.
(4) In contrast to sirshasana, sarvangasana with pressing the chin to the sternum is accompanied by an increase in HR acceleration of heart contractions and lower left ventricular diastolic filling than in sirshasana, although hydrostatic conditions of both postures seem to be equal. This hemodynamic effect is possibly induced by pressing the chin to the sternum, which causes thyroid compression in the second posture.
REFERENCES
1. Ebert D. Physiologische Aspekte des Yoga. Leipzig: Georg Thieme, 1988.
2. Ischida Y., Meisner J.S., Tsujioko K. et al., Left Ventricular Filling Dynamics: Influence of Left Ventricular Relaxation and Left Arterial Pressure, Circulation, 1986. vol. 74, №1, p. 187.
3. Mohar J.C., Agga-wal R., Arora B. and Khalilullah M., Effect of Preload and Heart Rate Manipulation on the Doppler Transmitral Flow Velocity Pattern: Search for Load-Independent Parameters, Ind. Heart J., 1993, vol. 43, №2, p. 105.
4. Jatabe S., Hyrabauashi M., Ushizima K. et al., Mitral Flow Dynamics in Patients with Hemodialysis: Assessment with Pulsed Doppler Echocardiography, Kokin-To-Junkan, 1991, vol. 39, №9, p. 91.
5. Afifi A. and Azen S. Statistical Analysis, New York: Academic, 1979.
6. Grigor’ev S.G., Levandovskii S.S., Perfilov A.M. and Yunkcrov V.I. (Statgraphics Programs for Personal Computer), St. Petersburg, 1992.
7. Appleton C.P., Halle L.K. and Popp R.L., Relation of Transmitral Flow Velocity Patterns to the Left Ventricular Diastolic Function: New Insights from a Co mbined Hemodynamic and Doppler Echocardiographic Study, J. Am. Coil. Cardiol., 1988, vol. 12, №2, p. 426.
8. Harizi R.C., Bianco J.A. and Alpen J.S. Diastolic Function of the Heart in Clinical Cardiology, Arch. Intern. Mcd.. 1988. vol. 148, №1, p. 99.
9. Sochanski M., Lang R.M., Weinert I. et al., Hemodynamic Prerequisites of the Occurence of Diastolic Mitral Valve Regurgitation, Am. J. Cardiol., 1993, vol. 71, №15, p. 1470.
10. Stoddart M.F., Person A.C., Kern M.J., et al. Left Ventricular Diastolic Function: Comparison of Pulsed Doppler Echocardiographic and Hemodynamic Indices in Subjects with and without Artery Disease, J. Am. Coll. Cardiol., 1989, vol. 13, №2, p. 327.
11. Schutzman J.J., Obarski T.P., Pearce G.L. and Klein A.L. Comparison of Doppler and Two-Dimensional Echocardiography for Assessment of Pericardial Effusion, Am. J. Cardiol., 1992, vol. 70, №15, p.1353.
12. Siegel R.J., Shan P.K. and Fishbein M.C. Idiopatic Restrictive Cardiomyopathy, Circulation, 1984, vol. 70, №2, p. 165.
13. Horstman E. and Benn M. Die linksventriculare diastolische Funktion bei der Herzinsuffizienz - eine dopplerechokardiographische Untersuchung, Z. f. Kardiol., 1989, vol. 78, №11, p. 738.
14. Bastrukov A.I. The Influence of Kapoten on Left Ventricle Diastolic Function in Patients with Cardiac Disease Combined with Stable Arterial Hypertension, Kardiologia, 1993, vol. 33, №4, p. 30.
15. Dzhakhangirov, T.Sh., The Dynamics of Systole-Diastole Relation in Patients with Chronic Cardiac Insufficiency during Treatment with Various Classes of Drugs, Cand. Sci. (Med.). Dissertation, Moscow, 1993.
16. Dabestani A., Takenaka K., Alien B. et al. Effects of Spontaneous Respiration on Diastolic Left Ventricular Filling Assessed by Pulsed Doppler Echocardiography, Am. J. Cardiol., 1988, vol. 61, №15, p. 1356.
17. Channer K.S., Culling W., Wilde P. and Jones J.V., Estimation of Left Ventricular End-diastolic Pressure by Pulsed Doppler Ultrasound, Lancet, 1986, vol. 1, №8488, p. 1005.
18. Hammentgen R., Kolvenbach M., Heck I., et al., Einfluss der Herzfrequenz auf die dopplerechokardiographisch ermittelte linksventriculare Fullungsdynamik (abstract), Klin. Wochenschr., 1989, vol. 67, suppl. 16, p. 70.
19. Vladimirov,Yu.M., Kh’yusman, I.V.A., and Stevart, PA., Doppler Study of Normal Fetal Circulation during Early Pregnancy, Ultrazvuk. Diagn. Acush., Ginek. Pediat., 1993, №1, p. 8.